TrackGap reads real App Store reviews across 3 markets and 46 competitor apps — and tells you what they complain about, whether anyone is making money, and where the gap is.
Free, instant, and tells you who is winning. It never tells you why their users are unhappy — which is the only thing you can actually compete on.
The right instinct, terrible method. Two hours in, you have a vague feeling and no structure. Nothing you can hand to a builder.
You get fluent, confident, generic advice. The model has neither the review corpus nor the actual revenue figures, so it can only echo public consensus.
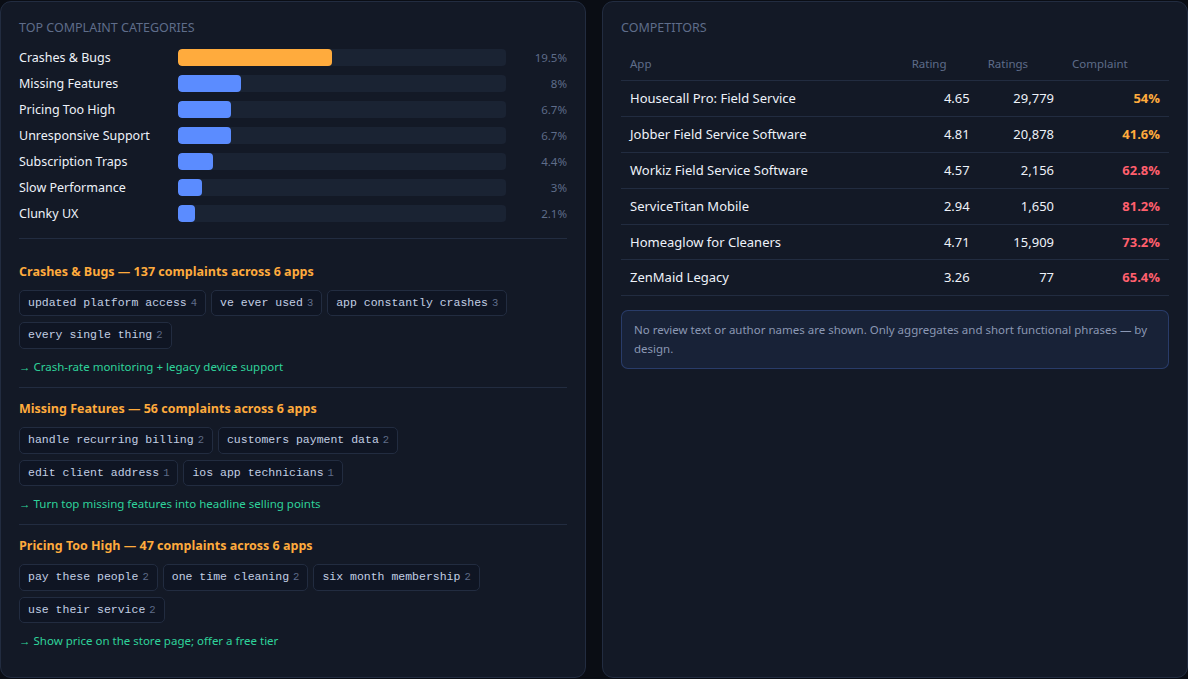
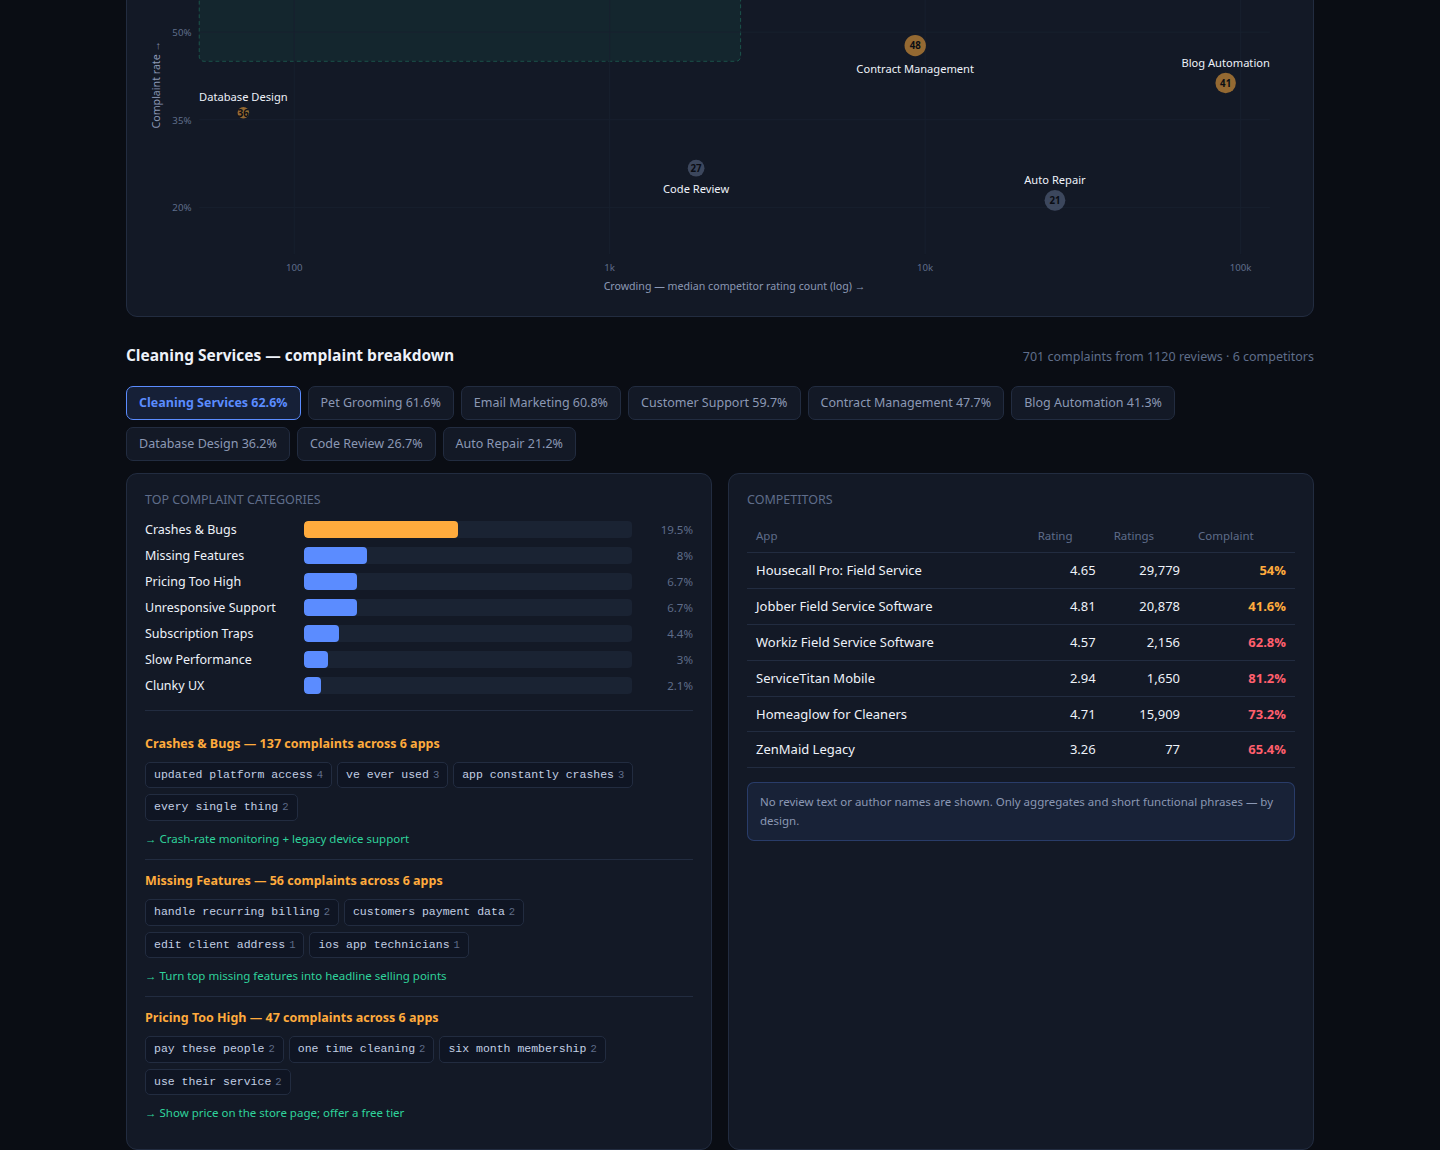
Every market is reduced to complaint categories, their share of the total, and — most useful — the actual recurring phrases users type. Not quotes you have to interpret, but patterns with counts.


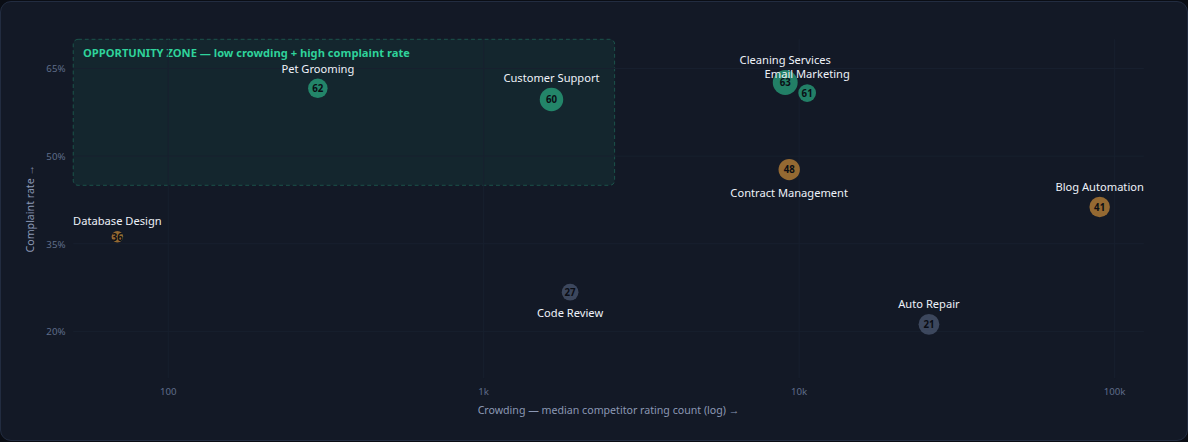
Two axes: how crowded the market is, and how angry its users are. The top-left corner is the answer — few strong competitors and a lot of justified frustration.
We mine Hacker News for first-hand "I built X, it makes $Y/month" cases and keep only the verifiable facts. If a market has no payment evidence, we say so — which is more useful than an optimistic guess.
This is the actual field-service market — 21 apps, recomputed from live App Store data every time we rebuild. Free ends where we say it ends.
| App | Rating | Ratings | Complaints |
|---|---|---|---|
| ServiceTitan Field | 3.43 | 5,188 | 35.9% |
| UKG Ready | 4.41 | 52,746 | 10.4% |
| CHAI: Social AI Platform- Chat | 4.30 | 289,145 | 14.6% |
| Angi for Pros | 3.93 | 39,841 | 22.8% |
| Reading App Store | Asking a chatbot | TrackGap | |
|---|---|---|---|
| Structured complaint categories | No | Guessed | Yes, with share % |
| Recurring phrases with counts | Count by hand | Invented | Real, counted |
| Do people actually pay | No data | No data | Verified cases |
| Compare 10 markets side by side | Days | Not comparable | Seconds |
| Alerted when things change | No | No | Weekly |
| Time spent | ~40 hours | 5 min, useless | 3 minutes |
Every market below has a free page with its complaint breakdown, all competitors, and payment evidence. No email required — this is the honest way to judge whether the paid report is worth it.
Use the free sample to decide whether this is worth $100. One payment, no auto-renewal — and no dashboard you have to log into to cancel, because we studied how much apps get trashed for exactly that.
Everything above looks outward — at markets you might enter. If you already ship an app and want someone reading your reviews and your named competitors' complaints every month, that's a different service.
Paying by card or from a personal account? Just say so in the email — I'll send whichever you need. Invoices go out same-day with bank details; work starts after payment, and the turnaround clock starts then, not when you ask.
Only Apple's publicly published iTunes RSS feeds and Hacker News' public API. No anti-scraping measures were circumvented. Importantly, we never display review text, usernames, or avatars — the product shows aggregates and short functional phrases only. That boundary is deliberate, and it's also why the output is more actionable. The full method, including what stays unclassified, is written up on the methodology page.
You can read individual reviews. You cannot read 700 of them and see the structure. One review feels like one angry user; 137 complaints in the same category is a product decision waiting to be made.
Because it lacks two things we have: a structured corpus of complaints, and real revenue numbers from people who built these things. Without both, a model can only restate what's already public consensus — which isn't where the opportunity is.
Core markets refresh weekly. If something shifts in a market you follow — a wave of new complaints, a new entrant, a new revenue case — you get an email. That's the only honest reason to come back every month.
Only mobile consumer apps today, and that's a real limitation we don't hide: the most profitable B2B web products aren't visible here at all (we found the web-scraping market is essentially empty on iOS). Adding non-mobile sources is on the roadmap.
Measured, not estimated: median coverage per report is 53%, ranging 29%–83% across 44 sample apps (1–2 star reviews), with roughly 75% accuracy on spot checks. What the rules can't place, we leave unplaced rather than forcing it into the nearest bucket — that would make the number prettier and every category noisier. Every report prints its own coverage figure so you can recompute it yourself. Good enough to rank which complaint dominates, not to treat any single percentage as exact.
No spam. One click to unsubscribe — we spent weeks reading people trashing apps for subscription traps, so we're not running one.